Manchester House Price Growth
Manchester’s property market has witnessed a sustained period of growth across the city for several years. With the introduction of the Northern Powerhouse Scheme in 2014, Manchester’s economy has seen increased infrastructure and property development. The increase in funding and development has seen the property market of the city grow organically and investors are turning their attention away from London and towards Manchester.
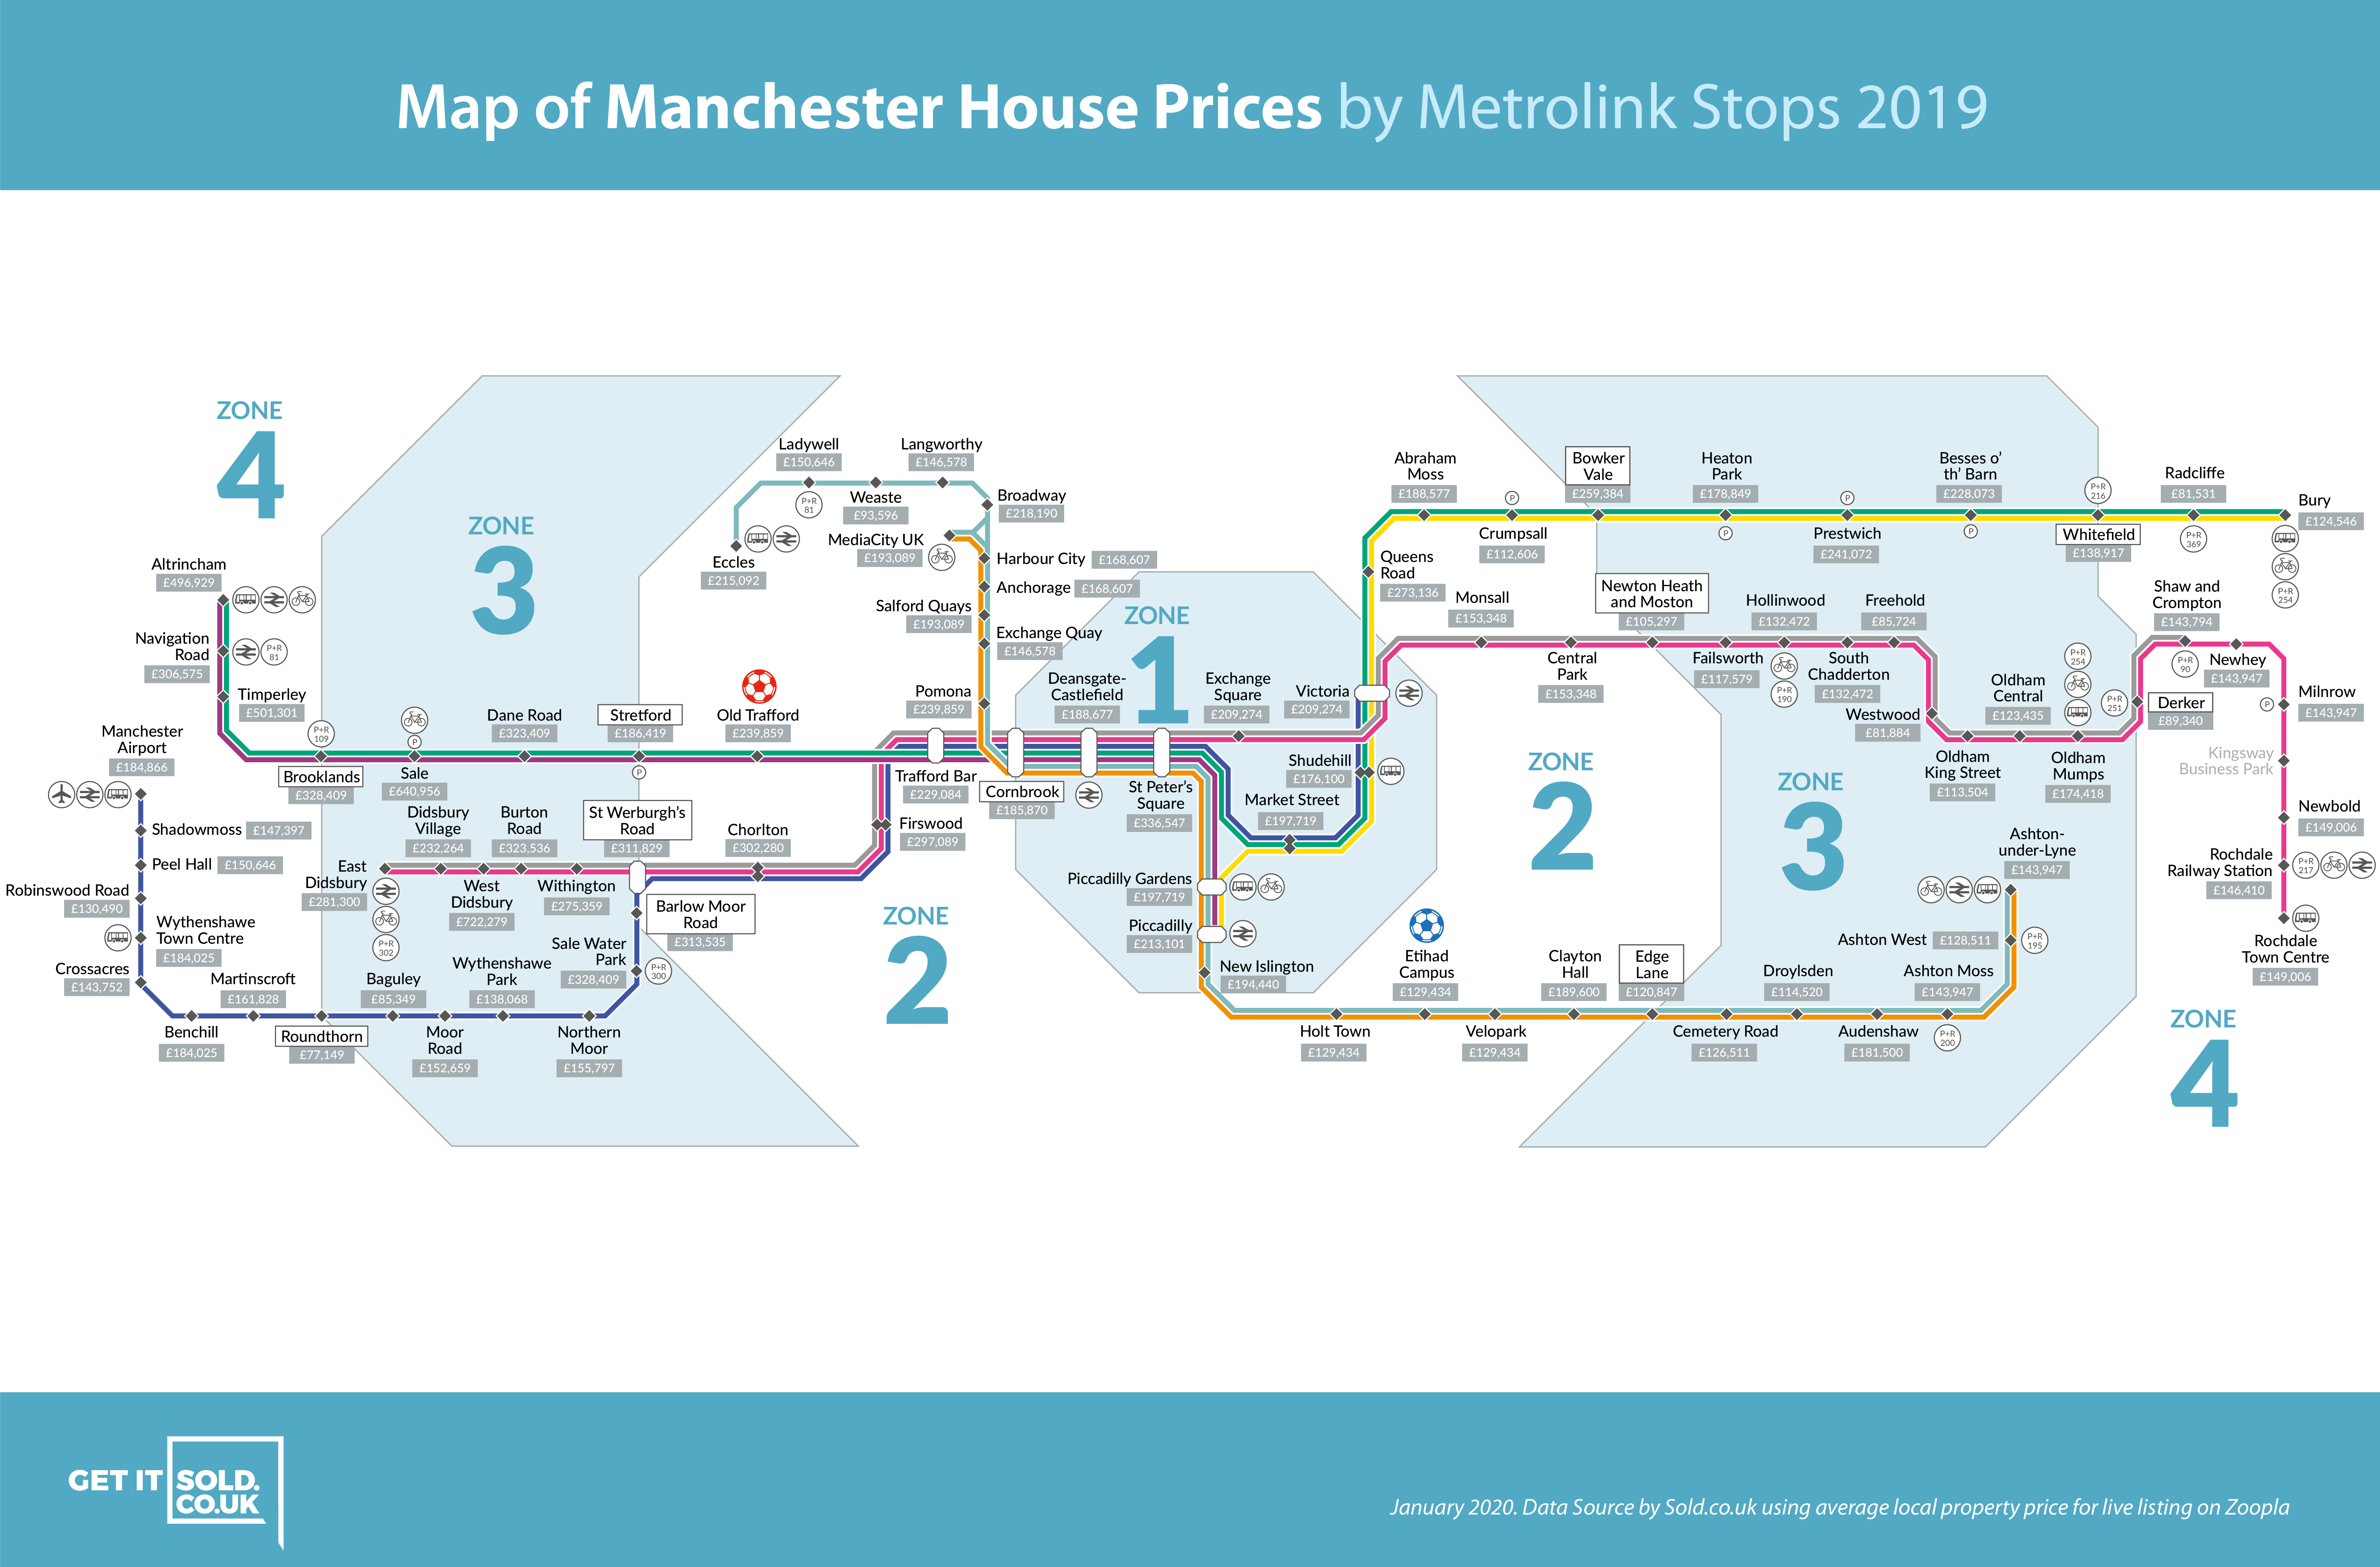
Research conducted by SOLD.CO.UK has analysed the average prices of all Manchester Metrolink lines, offering a distinct comparison between 2014 and 2019. With the level of investment Manchester has received due to the Northern Powerhouse scheme, the growth the property market has witnessed is above and beyond expected levels over the past five years.
Across the Metrolink network, property prices have increased by an average of £44,448 since 2014. Cast your eyes over the top three Metrolink lines which have witnessed the greatest increases.
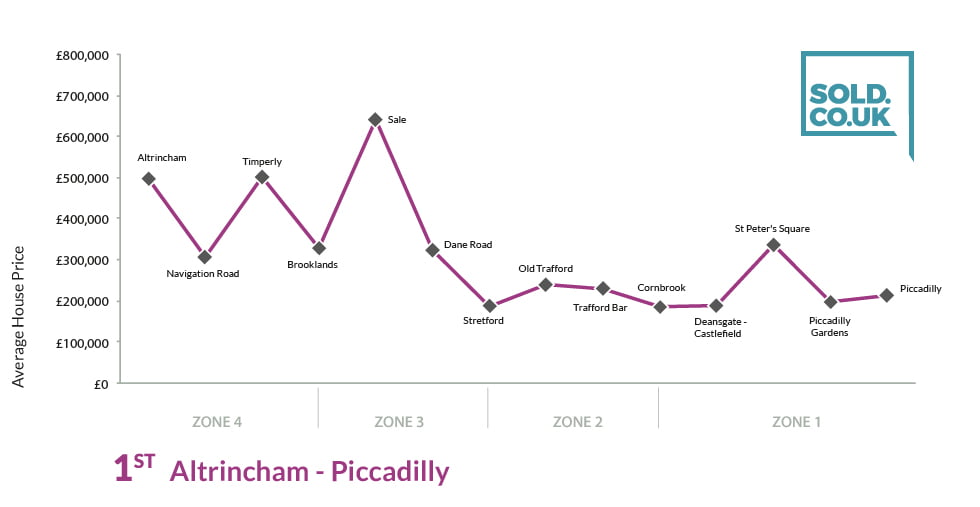
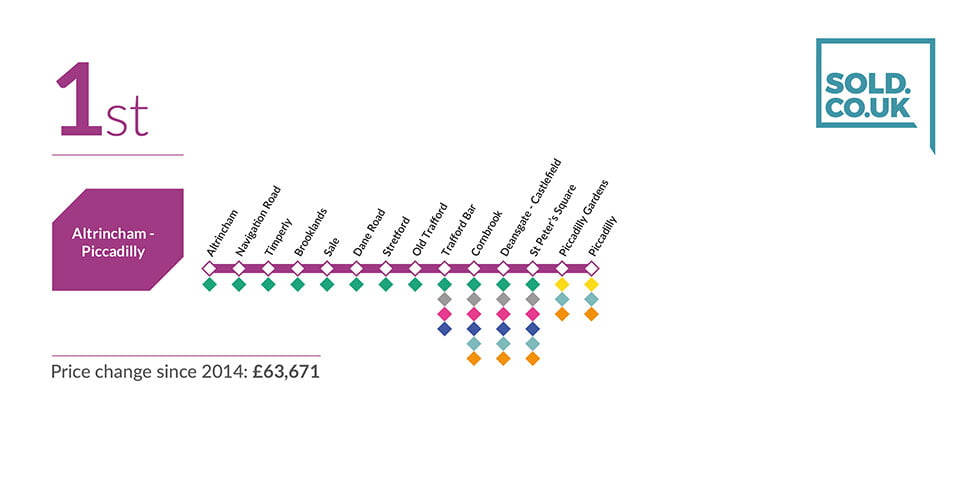
Altrincham to Piccadilly
2014-2019 Price Change: £63,671
Starting in south west Manchester and travelling north to Manchester Piccadilly, the line connects a large proportion of western Manchester, including the city centre. Acting as one of the main transport routes into the centre of Manchester for people living in suburbs and boroughs in the west of the city, this line is an important commuter route. Connecting some of Manchester’s busiest stops; Manchester Piccadilly, St Peter’s Square to residential hubs of Sale and Altrincham.
Although the line is home to just 14 stations, the Altrincham to Piccadilly line has witnessed the greatest average increase across all routes between 2014 and 2019. In 2014, the average price of a property was recorded at £248,818. Just five years later, this figure has increased by an astounding 25.6%. In 2019 you can now expect to pay an extra £63,671 for a home on the Altrincham to Piccadilly line, with an average property price of £312,489.
Whereas most people would expect the greatest increases to occur around the cluster of five stations located in Zone 1, the locations where property prices have skyrocketed are located across Zones 3 and 4. On average stations location in these zones have witnessed on average an increase of £70,000+ in the 5 years from 2014. The greatest increase was recorded in Sale, with a growth rate of 29.3%, taking the average price from £495,715 (2014) to £640,956 in 2019 (+£145,241).
Sale by far shows the greatest level of growth. However, Zone 4 tram stop Timperley recorded a similar astronomical increase of £86,056 over the five-year period, causing average 2019 property prices to sit at just over £500,000.
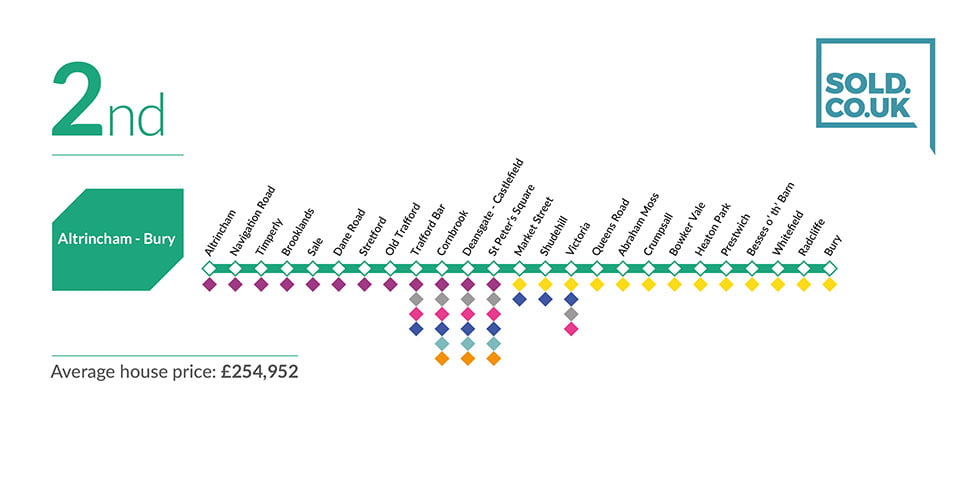
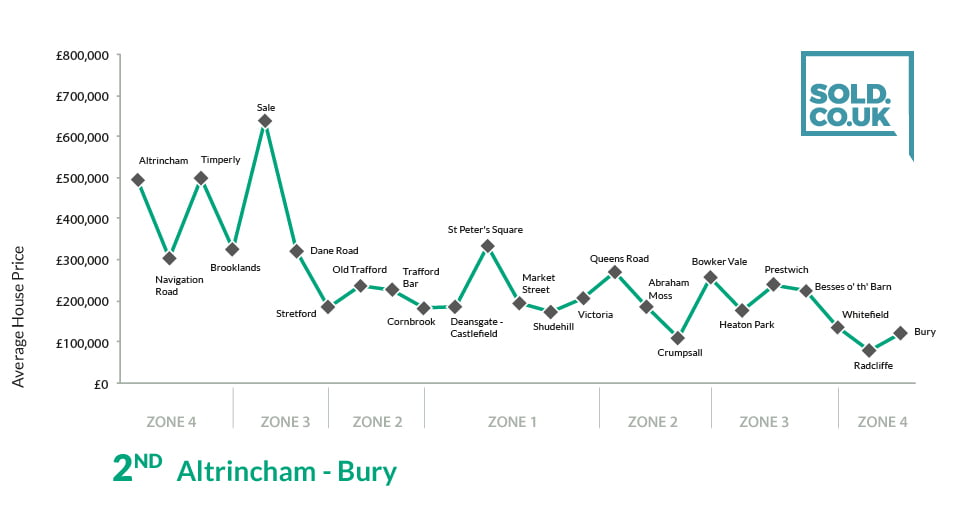
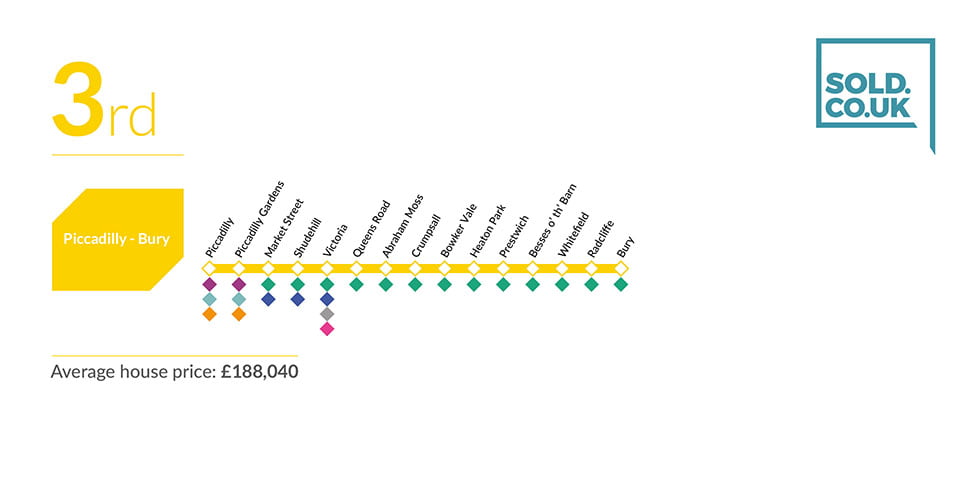
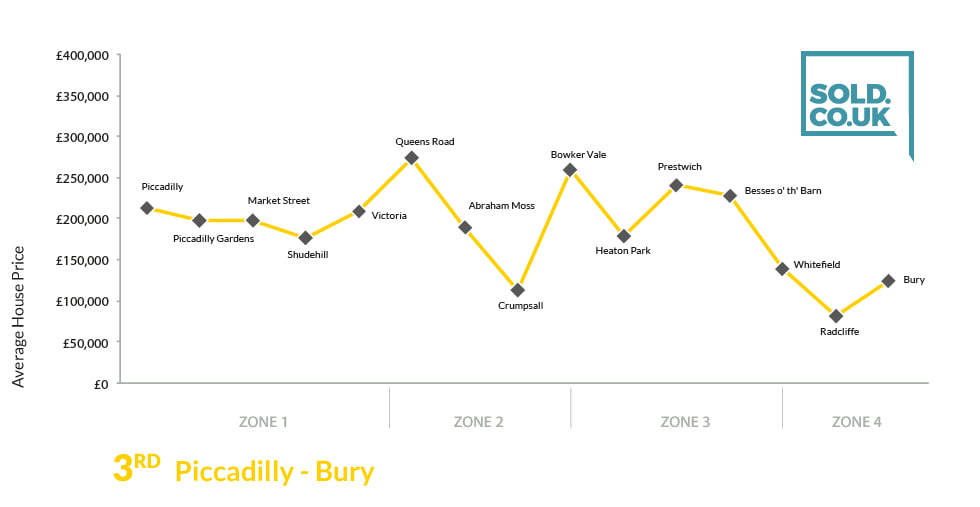
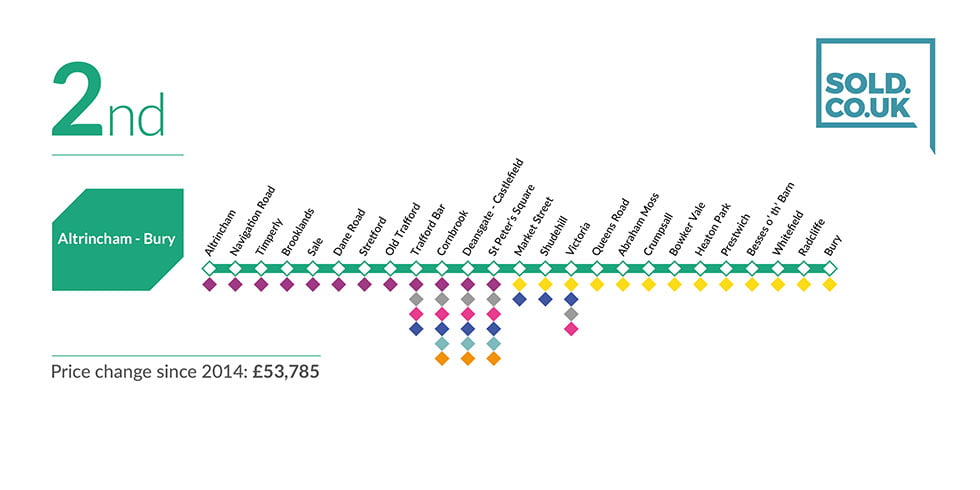
Altrincham to Bury
2014-2019 Price Change: £53,785
The Altrincham to Bury line follows the same route as the Altrincham to Piccadilly line as it travels into the centre of Manchester. Once it reaches St Peter’s Square, the line deviates and carries on its journey to the east of Manchester and heads towards Bury. As the line is the same up until St Peter’s Square, there is no surprise that the data of the first 12 stations is the same. For this reason, here at SOLD.CO.UK, we are going to focus on the price increases of stops from St Peters Square onwards, to provide greater coverage of property price changes across the city.
The Altrincham to Bury line, in its totality, witnessed a 26.7% average property price increase between 2014 and 2019. As a figure, properties on this line now sit at prices around £254,952.
Delving deeper into the property prices on this line between St Peter’s Square and Bury, the average property price of the line is £196,166 – an increase of 28.6 compared to 2014. The station on this route with the greatest average increase over the past five years is St Peter’s Square, with a price rise of 27.23%, £72,031 to £336,547 as of 2019.
Towards the western end of the line the highest property price increases featured in Zones 3 and 4. At the opposite end, Zone 2 observed the greatest increases over the past five years, with Queens Road adding £64,557 to the average property price and Bowker Vale, £61,309.
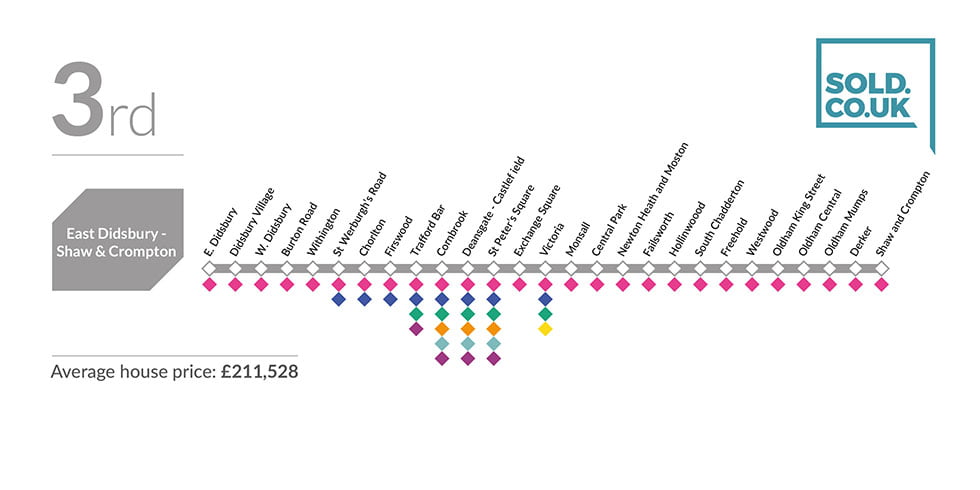
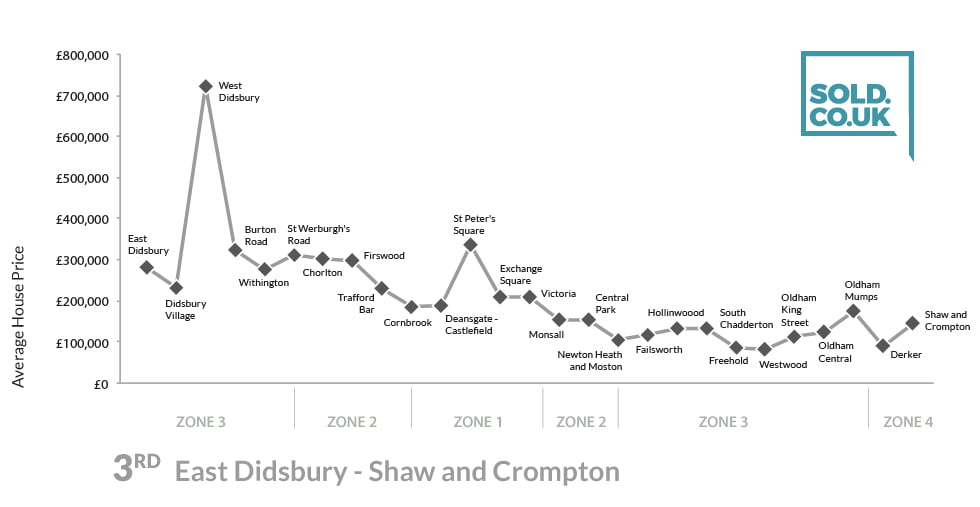
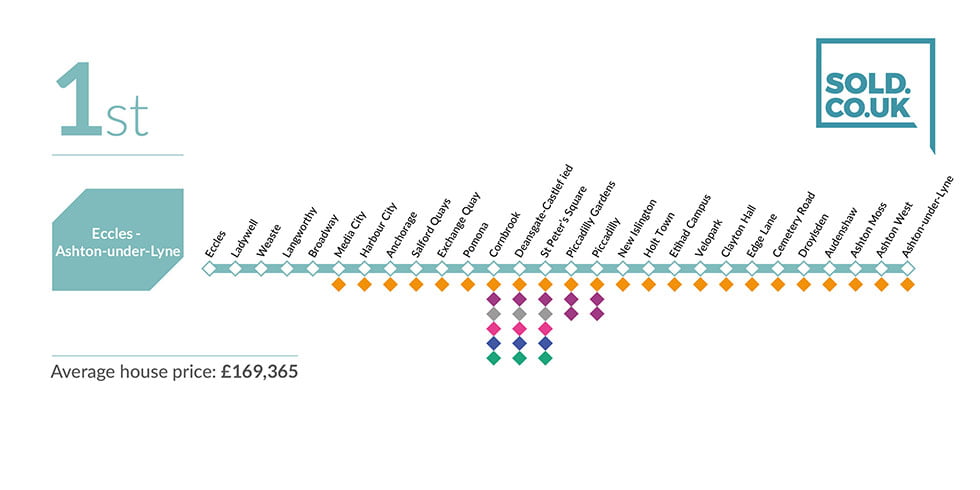
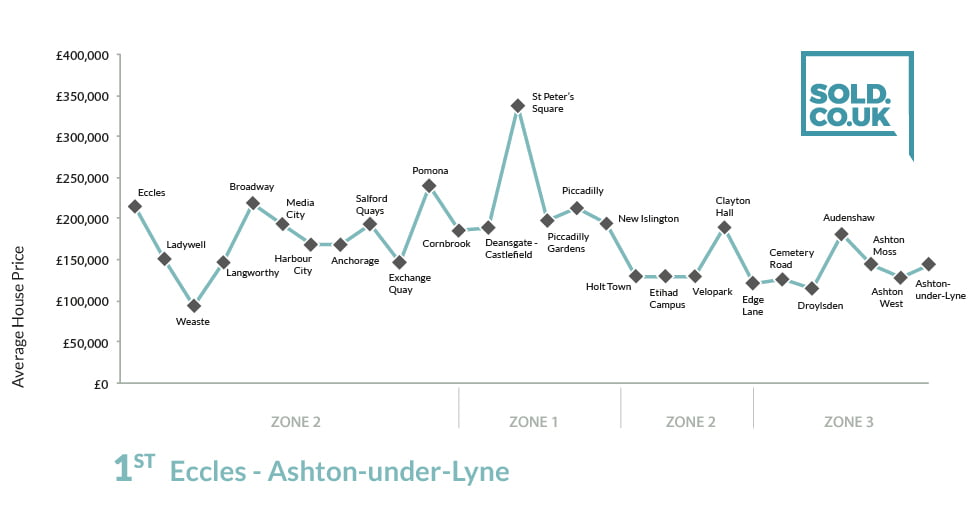
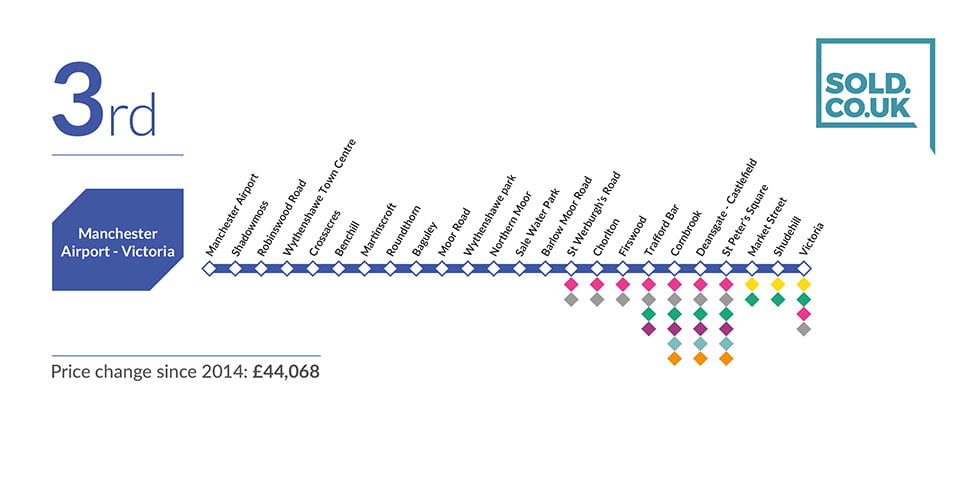
Manchester Airport to Victoria
2014-2019 Price Change: £44,068
One of the longest lines on the Metrolink boasts 24 tram stops and takes passengers from Manchester Airport to Victoria. From end to end a journey takes 58 minutes as the line zigzags its way through southern Manchester, travelling through Old Trafford before entering the city centre. Although the line connects two major transport hubs in Manchester, the route serves to cover the residential areas of Wythenshawe and the outskirts of Sale, acting as the main commuter line for residents.
Although this line is one of the more affordable out the 8 eight Metrolink routes, the Manchester Airport to Victoria line has seen a substantial between 2014 and 2019 in terms of average property price. In the five years SOLD.CO.UK has collated data for, this line has witnessed a 28.1% increase since 2014, with the average price of £200,909 in 2019.
The increases across this line are similar in nature across the entire Metrolink network, backing up the trend that the greatest increases have occurred in Zones 3 and 4. Located in Zone 3, Sale Water Park presented the greatest growth on the line with a £74,429 increase between 2014 and 2019, with prices in 2019 levelling out at £328,409. Shortly behind Sale Water Part, St Peter’s Square (+£72,031) and Barlow Moor Road (+£67,575) saw further average price rises over the five year period.